The online, shore-based Advanced Training on Ocean Synergy Remote Sensing course is designed to help students work with increasingly varied but complementary satellite data sets in synergy. The course will use a combination of standard and interactive lectures, together with the SEAScope synergy analysis tool (available free of charge for students to use after the course). There will be a focus on The Greater Agulhas Current Region, which will be used as an ocean laboratory to put what you learn in theory into practice. The interactive lectures are focused on specific areas of ocean synergy, and will help prepare you to bring your own ideas together for the course on board the ship.
The course objectives are to:
- Train the next generation of Earth Observation Ocean Scientists,
- Explain the theoretical principles and application of Ocean Colour Radiometry, Infrared and Passive Microwave Radiometry, Biogeochemical, Sea Surface Temperature, Sea Surface Salinity retrievals, Synthetic Aperture Radar and Radar Altimetry;
- Introduce different satellites and their payload instruments;
- Explore data through hands-on exercises using SAR, Optical, Infrared, Passive Microwave, and Altimeter data, tools/toolboxes and methods for the exploitation of EO satellite data in synergy over the ocean;
- Stimulate and support the exploitation of the ESA Earth Explorer and Copernicus Sentinel Missions.
- Apply knowledge of satellite measurements in synergy to understand the character and dynamics of the Greater Agulhas Current region
- Develop skills to interpret satellite ocean data together with in situ ocean measurements to characterize and understand the environmental and climate change of the oceans.
- Develop a network of international students participating in the training course
Structure of the course
The timetable for the course is included below, it could be subject to further changes. A student handbook is under development with further details about the course.
| Date | Module | Theme | Webex video | Lecture A | Interactive A | Lecture B | Interactive B |
|---|---|---|---|---|---|---|---|
| 05/09 | 1 | Introduction | Link to recording | LA1: Introduction to the Training Course (Johnny Johannessen) | ILA1: What we expect from you (Craig Donlon) | LB1: Round Table Introduction from Students and Lecturer Team | ILB1: Round Table Introduction from Students and Lecturer Team |
| 12/09 | 2 | Students and student groups | Link to recording | LA2: Student projects and group work – working together. | ILA2: The Greater Agulhas Current Region Ocean Laboratory | LB2: Thermal Imaging of the Ocean From Space | ILB2: Measuring Sea Surface Temperature (SST) from Space |
| 19/09 | 3 | Mesoscale & sub-mesoscale structures (Thermal imaging) | Link to recording | LA3: Introduction to Syntool and Sea Scope Tools | ILA3: Using Syntool and SEAscope Tools | LB3: Mesoscale and Sub-mesoscale characteristics of the Greater Agulhas Current Region | ILB3: Investigating Thermal features and their dynamics in the Greater Agulhas Current Region |
| 26/09 | 4 | Mesoscale and sub-mesoscale Structures (OCR imaging) | Link to recording | LA4: Ocean Colour Radiometry (OCR) of the ocean from space | ILA4: Measuring Chlorophyll-a using OCR from Space | LB4: Bio-geo-chemical Measurements of the Greater Agulhas Current Region | ILB4: Investigating biological features and dynamics in the Greater Agulhas Current Region |
| 03/10 | 5 | Ocean Circulation: Sea Level from Altimetry | Link to recording | LA5: Satellite Altimetry of the Oceans from space | ILA5: Sea Level estimates from Satellite Altimetry | LB5: Estimates of Ocean Circulation from Satellite Altimetry | ILB5: Ocean Dynamics of the Greater Agulhas Current Region |
| 10/10 | 6 | Mesoscale Salinity & SST from Microwave Radiometers | Link to recording | LA6: Microwave Radiometry of the Ocean from Space | ILA6: SST/SSS/wind observations from Microwave Radiometers | LB6: Salinity and extreme wind speeds using Microwave Imaging | ILB6: The Greater Agulhas Current Region from Microwave Imaging |
| 17/10 | 7 | Ocean Circulation from Synergy (altimeters) | Link to recording | LA7: Satellite Altimetry in synergy with other measurements | ILA7: Estimates of Ocean Surface Currents using Altimetry and SST | LB7: Overview of the Benguela Upwelling System | ILB7: SST-Chlorophyll correlation in the Greater Agulhas Current Region |
| 24/10 | 8 | Sea State measurements from Space (SAR+wave Scatterometry) | Link to recording | LA8: Estimating Sea State from Space using Synthetic Aperture Radar (SAR) | ILA8: Exploring Sea State using SAR | LB8: Directional Wave Spectrum from space | ILB8: Waves in the Greater Agulhas Current Region (I) |
| 31/10 | 9 | Wave-current interactions from Space (SAR, Glitter) | Link to recording | LA9: Ocean Signatures from Optical Sun Glitter | ILA9: Using Sun Glitter Imagery to study Sea State | LB9: Ocean Sea State From Satellite Measurements in Synergy | ILB9: Waves in the Greater Agulhas Current Region (II) |
| 07/11 | 10 | Marine Inorganic Carbon | LA10: Marine Inorganic Carbon from Space | ILA10: Estimating CO2 Fluxes from Space | LB10: Ocean Acidification from Space | ILB10: Ocean Acidification in the Greater Agulhas Current Region | |
| 14/11 | 11 | Climate Change and Polar Oceans | Link to recording | LA11: The Southern Ocean from space | ILA11: Investigating the Southern Ocean from Space | ILB11: Earth's Ice Imbalance | ILB11: Ice Sheets and Sea level from Space |
| 21/11 | 12 | Air-sea interaction in the Greater Agulhas Current Region | Link to recording | LA12: How the Ocean is Connected | ILA12: Understanding Regional Climatology and its application | LB12: Observing Extreme Storm Events from Space | ILB12: Extreme Storm Events in the Southern Ocean |
| 28/11 | 13 | Ocean modelling of the Greater Agulhas Current Region | Link to recording | LA13: Ocean Models for the Greater Agulhas Current Region | ILA13: Comparing Ocean Model Output with Satellite Observations | LB13: The Multi- Dimensional Structure of the Agulhas Current System | ILB13: Estimating Indian Ocean Water Transport using Ocean Model Outputs |
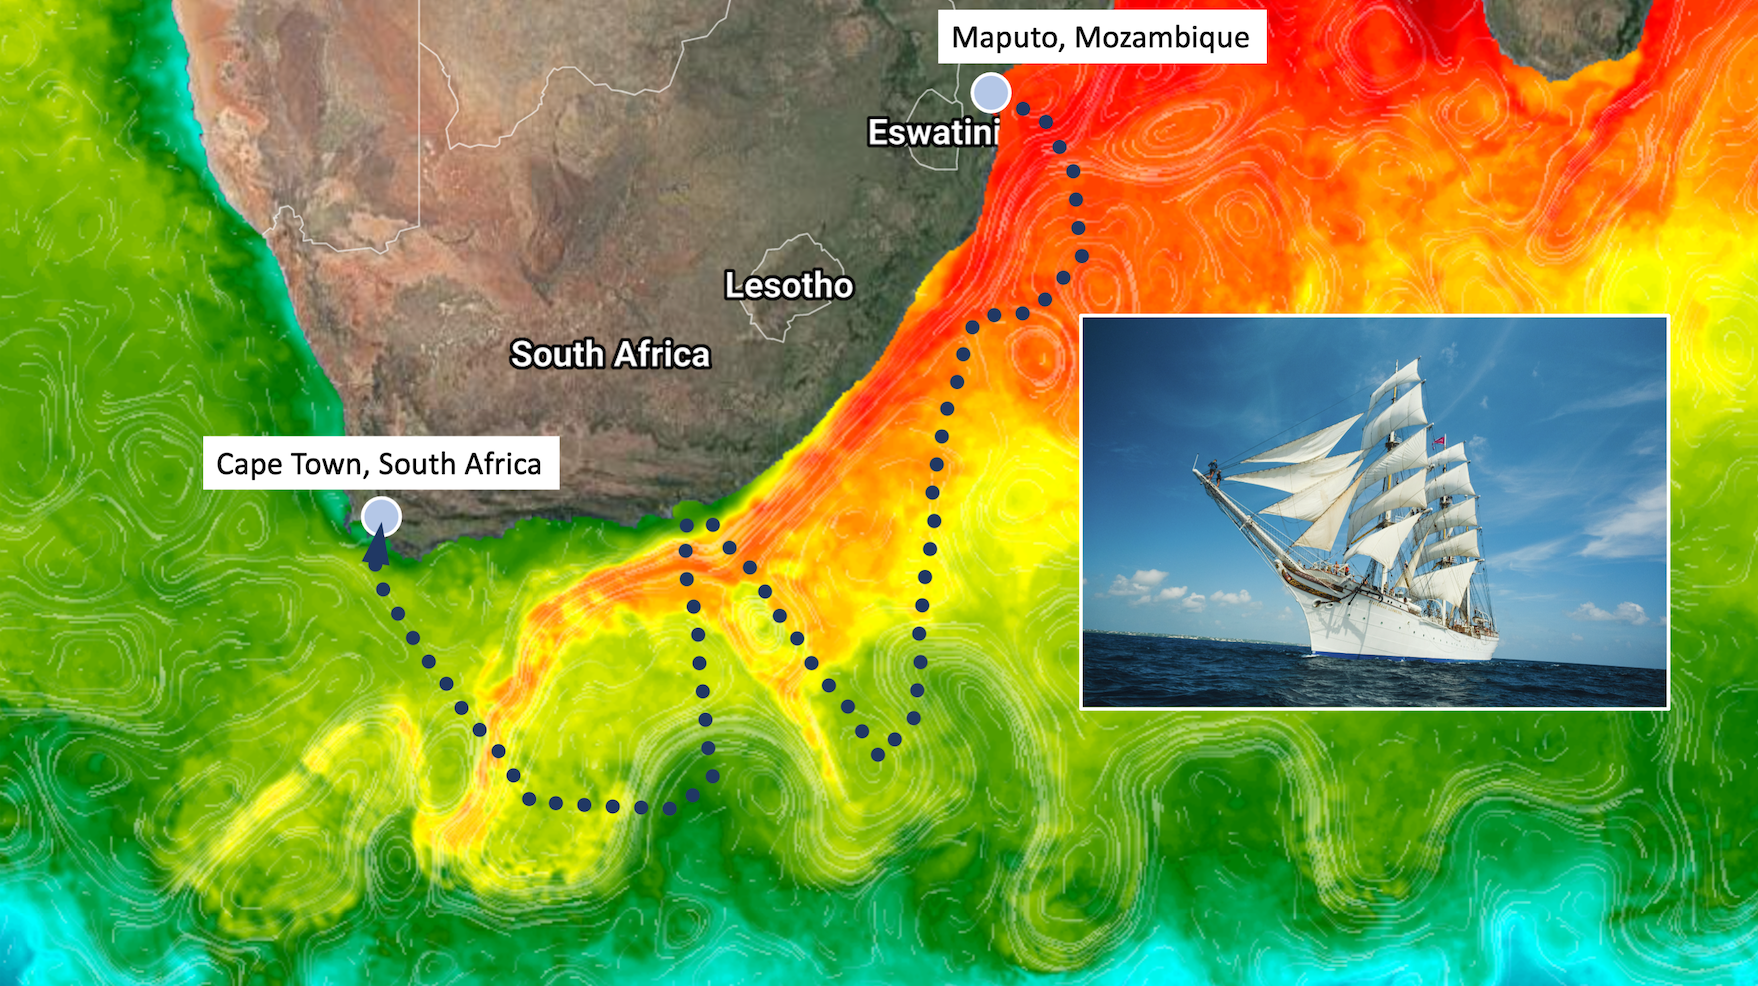
| 05/12 | 14 | Preparing for the At-sea course | Link to recording | LA14: Using in situ and Satellite data: Simulating the Voyage from Maputo to Cape Town | ILA14: Demonstration of NRT data from St. Lehmkuhl | LB14: Practical information for joining the ship | Q&A |
Lecture: A formal lecture given to introduce the subject
Interactive Lecture: a more informal style using interactive tools to handle data in a laboratory environment
Timings:
- Sessions will be held every Monday between 16:00-19:00 CET.
- Sessions will be held via WebEx, a link will be sent.
- The first course session is planned on 5th September 5th 2022, then every week afterwards, with the final lecture on the 5th December.
- Lectures will be recorded and will be available online afterwards.
Software and Tools
The course makes use of the Syntool Visualization Platform. This portal allows for highly attractive display and overlay of near real time satellite data together with in-situ data and model fields. Key variables we are interested in include: sea surface temperature, ocean color, surface geostrophic current, near surface wind and ocean waves. The selection of variables to be displayed is controlled by the "Products" menu located to the left. The date and time of selection is controlled by the lower horizontal panel. The viewing options of the Visualization Platform range from global to regional and offers a wide span of variable collocations and overlaying possibilities. Here, the position of the Statsraad Lehmkuhl ship is visible on the portal, check under In Situ data to find it! Moreover, surface drifter trajectories can be displayed on top of the near coincident SST, ocean color, surface roughness and surface current maps, clearly demonstrating the strength of this visualization tool both for research and dedicated applications. The visualization portal will also routinely be used for planning and execution of data collection during the sail-voyage, including deployment of surface buoys. For the course, we will use the standalone training module of the platform, known as the SEAScope Viewer that each participant will need to download.
Lecturers
The team of lecturers has been composed of Principal Investigators and Scientists from leading universities and research institutions.
Dr Alejandro Egido, European Space Agency, ESTEC, The Netherlands
Alejandro is an Ocean and Hydrology Earth Observation Scientist in the Earth Surface and Interior Section at ESA’ Mission and Science Division. With an engineering background, before joining ESA Dr. Egido was a Lead Scientist at the National Oceanic and Atmospheric Administration Laboratory (NOAA) for Satellite Altimetry in Washington, DC, USA. During his time at NOAA, he worked primarily on synthetic aperture radar (SAR) altimetry developing fundamental research and science products from SAR altimeter missions. He most notably developed fully focused SAR (FF-SAR) altimetry, a novel data processing technique that enables a drastic improvement in the along-track resolution of SAR altimeter data. Dr. Egido and his team then went on to develop science applications for this technique for the open ocean, sea ice and rivers and lakes. Before joining NOAA, he worked in the Space Department at Starlab Barcelona, Spain, developing research projects for ESA. Through these projects he was able to write his PhD Thesis on the topic “Global Navigation Satellite Systems Reflectometry (GNSS-R) for Land Remote Sensing Applications”. He received his PhD, Cum Laude, from the Signal Theory and Communications Department of the Technical University of Catalonia, in Barcelona, Spain, in 2013. Dr. Egido studied telecommunications engineering and Master of Science at the University of Zaragoza, Spain, with specialisation in digital signal processing and microwave propagation.
Dr. Estel Cardellach, Institute of Space Sciences (ICE-CSIC, IEEC)
Estel received the Ph.D. degree in physics from the Polytechnic University of Catalonia, Barcelona, Spain, in 2002. She studies scientific applications of Global Navigation Satellite Systems (GNSS) and other Sources of Opportunity (SoOp) for remote sensing of the earth. After postdoctoral positions at NASA/JPL (2003) and Harvard University - Smithsonian Center for Astrophysics (2004) she has been with the Institute of Space Sciences (ICE-CSIC/IEEC), Barcelona, Spain. She was Co-Chair of the Science Advisory Group of ESA’s GEROS-ISS mission, and a Co-Principal Investigator of the G-TERN mission proposal (ESA EE9 Call). Currently, she is the Principal Investigator of the Radio-Occultation and Heavy Precipitation aboard the PAZ satellite and Co-Chair of the ESA's 2nd Scout mission (HydroGNSS) Science Advisory Group.
Dr. Bertrand Chapron, IFREMER, Brest, France
Bertrand graduated from the Institut National Polytechnique de Grenoble in 1984 and received the Doctorat National (Ph.D.) in Fluid Mechanics in 1988. He spent three years as a post-doctoral research associate at the NASA/GSFC/Wallops Flight Facility, USA. He has experience in applied mathematics, physical oceanography, electromagnetic waves theory and its application to ocean remote sensing. He is currently responsible for the Oceanography from Space Laboratory, IFREMER.
Dr. Fabrice Collard, Ocean Data Laboratory, Brest, France
Fabrice graduated from the Ecole Centrale de Lyon in 1996, where he studied off-shore engineering. In 2000, he received the PhD in oceanography and meteorology from Paris 6 University. His thesis was dedicated to the three dimensional aspect of wind-wave field. He spent two years working on HF radars as a post-doctoral research associate at RSMAS, Miami, USA. He then joined IFREMER for the cal-val of the SAR Wave mode onboard ENVISAT.
Starting a small company, BOOST Technologies, with two other colleagues, he developed tools for wind/wave/current retrieval from SAR data before BOOST became the Radar Application Division of CLS of which he was head of the R&D department, working on the development and validation of surface wind, wave and current retrieval processor for ENVISAT and Sentinel-1. He then started in 2013 a new startup, OceanDataLab (https://www.oceandatalab.com) to develop tools and methods for analysis of Ocean Remote Sensing data, with an emphasis on exploiting the synergy between the different satellite/in-situ sensors for data-driven model development and numerical simulations validation.
Dr. Gary Corlett, EUMETSAT, Germany
Gary is a remote sensing scientist at EUMETSAT specialising in SST retrieval from SLSTR. He graduated from the University of Leicester in 1993 (B.Sc. Chemistry) and 1997 (Ph.D. Chemical Physics) and has 20-years’ experience in remote sensing of both the Earth’s atmosphere and surface. His current research interests are related to comparing satellite derived SST to in situ measurements over long time scales and understating the uncertainties throughout the process, as well as developing new high-spatial resolution thermal imagers. Prior to joining EUMETSAT in 2018 he was a research fellow in Earth Observation at the University of Leicester and director of the GHRSST International Project Office.
Dr. Ben Loveday, EUMETSAT, Germany
Ben has a master’s degree in physical oceanography from the University of Southampton (2009) and PhD in numerical modelling of the Greater Agulhas system from the University of Cape Town (2014). He worked for several years at Plymouth Marine Laboratory as a marine Earth Observation scientist, gaining experience in using multiple remote sensing techniques - including ocean colour, SST, altimetry and SAR. Ben has contracted for EUMETSAT since 2019, and currently runs the Copernicus Marine Training Service on their behalf.
Dr. Craig Donlon, European Space Agency, ESTEC, The Netherlands
Craig received a Ph.D. Oceanography (1994) Department of Oceanography, University of Southampton, UK and a B.Sc. First class (Hon) in 1998 at Department of Environmental Science, University of Lancaster, UK. He worked at the Met Office UK for 5 years in the Oceanography Section, the University of Colorado, USA as an Assistant Research Professor, and, at the European Commission Joint Research Centre Italy for 5 years. His main interests are remote sensing of oceans and ice and he is currently the Principal Scientist for Oceans and Ice at the European Space Agency.
Dr. Lucile Gautier, Ocean Data Laboratory, Brest, France
Lucile graduated from a general engineering school (ENSTA, Ecole Nationale des Techniques Avancées, with a specialization in environment) in 2009. She received her PhD in 2013 on Improving the estimation of ocean surface currents using sea surface temperature and chlorophyll high resolution images. She spent two years at JPL (Jet Propulsion Laboratory, NASA / Caltech, Pasadena, US) working on using the synergy of remote sensing observation to improve the estimation of the surface of the ocean. She has also been involved in the scientific definition of the SWOT mission, which is an innovative mission aiming at measuring ocean surface dynamic at high resolution.
In late 2015, she has joined OceanDataLab and she is now a Research Engineer, working on improving the reconstruction of ocean surface current using various remote sensing data as well as on the use of the synergy of data and Lagrangian diagnostics to improve our understanding of the ocean surface dynamics.
Prof. Johnny Johannessen, NERSC, Bergen, Norway
Johnny has 30 years experience in satellite remote sensing in oceanography and sea ice research. In particular, he has focused on the use of synthetic aperture radar (SAR) to advance the understanding of mesoscale processes along the marginal ice zone and along open ocean fronts and eddies. Johhny has participated in 15 international field campaigns and has been chief scientist on 10 of these cruises, predominantly in the Arctic Marginal Ice Zones and in the Norwegian Coastal Current. In the last 15 years he has also been involved in development and implementation of operational oceanography both at national and international level. Johnny has authored/co-authored more than 200 scientific and technical publications, reports and book articles of which 90 papers are published in International Review Journals and 22 are published as peer review book articles.
Johnny Cand. Real from University of Bergen in 1979. Dr. Philos from University of Bergen in 1997. Research Director in Ocean Remote Sensing, Nansen Environmental and Remote Sensing Center, Vice director Nansen Environmental and Remote Sensing Center since 2010. Associate Professor at the Geophysical Institute, University of Bergen since 2002.
Dr. Marjolaine Krug, Department of Forestry, Fisheries and the Environment, Cape Town, South Africa
Marjolaine is a physical oceanographer with expertise in satellite oceanography and ocean glider observations. Her research has focused on the dynamics and variability of the Agulhas Current as well as interactions between the Agulhas Current and the coastal and shelf regions. Marjolaine is currently working for the South African Department of Forestry, Fisheries and the Environment (DFFE), where she leads the development of the Oceans and Coastal Information Management System (OCIMS). The OCIMS is a national South African project which aims to improve ocean governance and the blue economy through the provision of knowledge and decision-support tools.
Dr. Marie-Hélène Rio, European Space Agency, ESRIN, Italy
Marie-Hélène is a senior scientist. She holds a space engineering degree plus a PhD in physical oceanography and has a 20 year long experience in altimeter data analysis and validation, and in space and in-situ data synergy for calculating added-value ocean products. She spent most of her scientific career at CLS, a subsidiary company from the French Space Agency (CNES), where she carried out seminal work on the estimation of the ocean Mean Dynamic Topography and mean geostrophic surface circulation from the combination of space (altimetry, gravimetry, SAR) and in-situ (drifters, T/S profiles) data. She has also worked on estimating the Ekman response to the wind forcing by developing empirical models based on the combination of altimeter, wind and drifter data. Recently she has been working on innovative algorithms for calculating the ocean surface currents from the synergy of altimetry and Sea Surface Temperature or Ocean Color images. In 2018 she joined the Science, Applications & Climate Department from the European Space Agency, where she develops and manages ocean science and application projects covering a wide range of topics such as upper-ocean dynamics, marine carbon cycle, water quality, ocean extreme events, marine biodiversity, ocean health, etc.
Dr. Nicolas Reul, IFREMER, Laboratoire d'Océanographie Spatiale, Toulon, France
Nicolas is a research scientist at IFREMER focussing on the development and exploitation of satellite passive microwave measurements including ESA SMOS. See http://annuaire.ifremer.fr/cv/16746/en/ for a full bibliography of papers and activities.
Prof. Mathieu Rouault, Nansen Tutu Center for Marine Environmental Research, South Africa
Mathieu is co-director of the Nansen Tutu Center for Marine Environmental Research in Cape Town and a Professor in the Department of Oceanography, both at the University of Cape Town. He is French but has been working at the University of Cape Town since 1993. He is a keen surfer and passionate about the ocean. His research encompasses all aspects of ocean-atmosphere interaction, from numerical modeling to experimental work at sea, from meteorology and physical oceanography to climatology, and now the impact of climate variability and change on marine ecosystems and water resources. His motivation is to study and understand any disturbance in the ocean or inland detrimental to society in order to better monitor and forecast. Another motivation shared by the associates and sponsors of the Nansen Tutu Center is the training of African and Southwest Ocean Indian students and postdoctoral fellows in order for them to become internationally recognized scientists in the field of meteorology, climatology, and physical oceanography.
Assoc. Prof. Jamie Shutler, University of Exeter, UK
Jamie is an oceanographer with a wide range of interests that exploit in situ observations, satellite Earth observation and models to study and monitor the marine environment, particularly in relation to climate and water quality. This includes studying atmosphere-ocean gas exchange of climatically important gases, the distribution of calcium carbonate in the ocean, evaluating the quality of model and Earth observation data, and developing approaches for water quality monitoring of bathing waters and aquaculture sites. He has also published research on developing and exploiting computer vision techniques for biometrics (gait), medical imaging (breast cancer) and surface ocean currents.
Dr. Ziad El Khoury Hanna, Ocean Data Lab, France
Ziad holds an engineering degree in Computer Science from the Ecole Nationale d'Ingénieurs de Brest (ENIB), France. In 2015 he joined OceanDataLab as software engineer, where he designed and developed a large part of the websites hosted by ODL, which he now maintains. He is also responsible for the design, development and integration of web visualization and analysis tools for ocean data (Syntool and SEAScope) as well as the new online sharing platform SEAShot accessible from the Ocean Virtual Laboratory (OVL) web portal.
Dr. Lasse Pettersson, NERSC, Norway
I am a senior scientist and research coordinator at the Nansen Environmental and Remote Sensing Center in Bergen, Norway. My university education is in physical oceanography, with research interests within studies and monitoring of marine ecosystems, harmful algae blooms, and waters quality in the Arctic and temperate oceans. I have experience with research and applications of satellite Earth observation data for marine and sea ice environmental and climate studies and applications. Triggered by a fish killing harmful algae bloom (HAB) of Chrysocromulina Polylepis in Norwegian coastal waters in 1988, I have focused on coastal optical remote sensing research and HAB service development. I have experience in international project management and cooperation funded by Research Council of Norway, European Commission, European Space Agency, industry, and other agencies. I have extensive experience in international scientific and educational cooperation, with Russia (since 1992), with India (1998) and Bangladesh (2011). I have co-organized and lectured at more than 15 international interdisciplinary post-graduate research schools. I have published about 90 scientific referee papers, eight books, several book contributions, teaching material, more than 150 technical client reports and 35+ popular scientific publications and chronicles.